
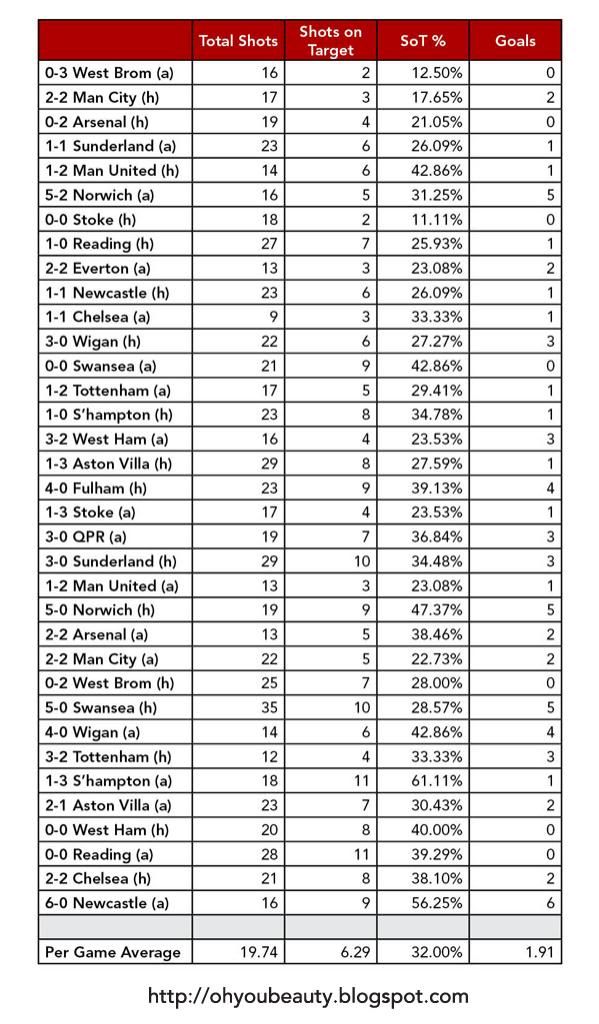
Liverpool's shots per match vary fairly wildly from game to game, but have overall stayed fairly consistent through the season. Over the first ten matches, Liverpool averaged 18.6 shots per match. Over the next ten matches, 19.7 per match. And over the last ten matches, 21.2 per match, an average made more emphatic by the aberrant 35 against Swansea.
But as the season's gone on, Liverpool are putting a greater number of those shots on target. Over the first ten matches, 4.4 shots on target per match. Over the next ten matches, 6.3 per match. And over the last ten matches, 8.1 per match.
And, unsurprisingly, that's led to more goals per match. 1.3 over the first ten, 1.8 over the next ten, 2.3 in the last ten.
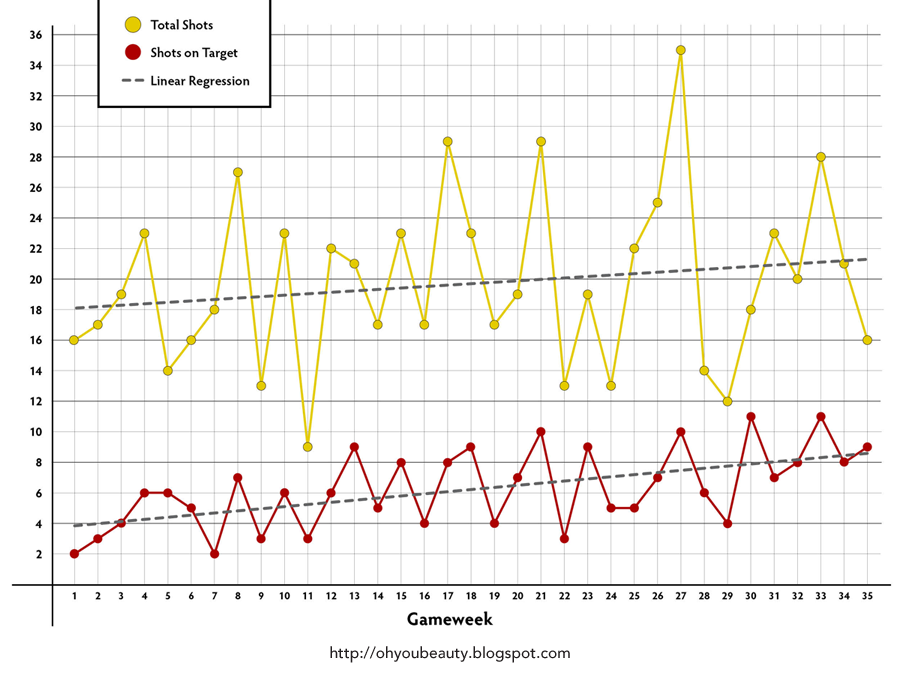
This week-by-week chart helps demonstrate that while both Liverpool's shots-per-game and shots-on-target-per-game are trending upwards, the shots on target average is trending upward at a greater pace.
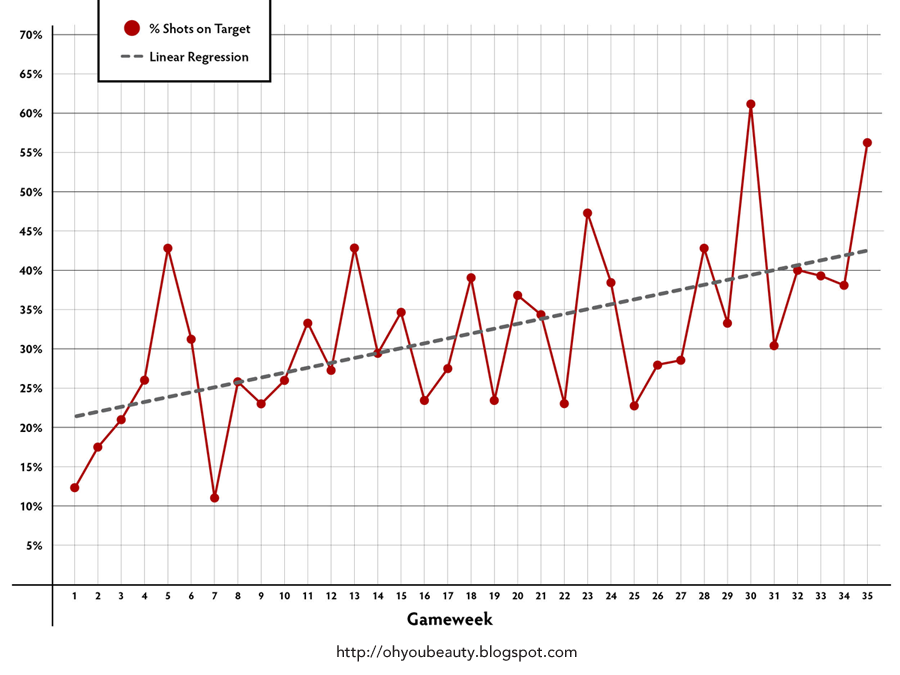
As is Liverpool's shots-on-target percentage, even more dramatically.
Some progression would have been expected regardless of January transfer business – at least, that's what *should* happen in a manager's first season – but Liverpool's winter acquisitions were a turning point.
In the 21 matches before Sturridge's first league appearance, Liverpool averaged 19.6 shots per match, 5.6 shots on target per match, and 1.6 goals per match. In the 14 matches since his debut in the 1-2 loss to United, Liverpool have averaged 19.9 shots per match, 6.7 shots on target per match, and 2.4 goals per match. It's even more noticeable in the nine matches since Coutinho's full debut (it's hard to blame him for the last 10 minutes of that frustrating loss to West Brom): 20.8 shots per match, 8.2 shots on target per match, 2.6 goals per match, and 41.1% of shots on target.
For comparison, Liverpool averaged 17.57 shots per match last season, 5.52 on target, putting 31.4% of those shots on target. And the season-long trend lines for both shots per match and shots on target per match remained fairly static; the average number shots on target actually slightly decreased as the season went on. There was no progression. And as we all remember, Liverpool got worse as the campaign slipped away from them, although there were admittedly multiple reasons for it.
It's both obvious and simplistic (and as the match at Southampton proves, not always true), but when Liverpool put more of their shots on target, Liverpool have a much better chance of winning. And Liverpool have been putting more of their shots on target as the season's gone on.
3 comments :
Stats people:
If you're curious, the linear regression equations:
Shots:
Y = 0.0943977591x + 18.043697479
R squared = 0.0295462681
Shots on Target:
Y = 0.1422969188x + 3.7243697479
R squared = 0.3239486832
Shots on Target %:
Y = 0.6236219574x + 20.7726767263
R squared = 0.3444816688
From using Excel's (well, OpenOffice's) trend line function because I am nowhere near smart enough to do the math by myself.
Nate,
Love me some stats. This backs up the general feeling I've been having as the season has gone on.
Excellent as always. Keep up the great work.
Something I noticed earlier in the season was that before Rodger's possession based philosophy took hold Liverpool lacked patience in their offensive play. By that I mean they took a lot of potshots when the opponent was hard to break down.
http://www.eplindex.com/22152/liverpool-wrong-type-shots-stats-analysis.html
This was of course written extremely early on in the season so I don't know if there's a correlation between Liverpool putting more shots on target and them taking more shots (proportionally) that are more likely to be on target in the first place.
Post a Comment