
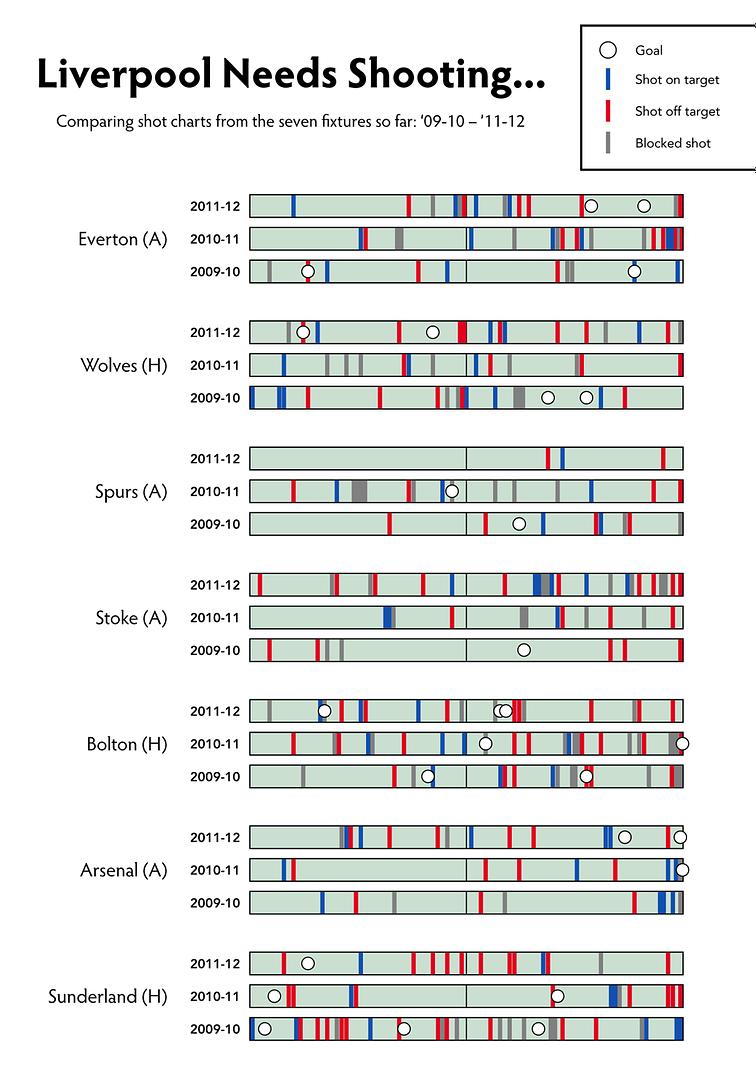

As usual, I'd recommend opening the main graphic in a new window. It's prettier that way, plus you can zoom in to see all those painstakingly placed bars. Also, as an FYI, when goals appear atop shots (circles on top of bars), it means the two incidents happened in the same minute, and it's usually for one of two reasons. If a goal's atop a blue or gray bar (on target or blocked shot), it's a goal tallied from a rebound. If it's atop a red, off-target bar, it's probably an own goal. Just to clarify the potentially convoluted design.
So, the point of this?
It's not especially heart-warming to see very similar totals between this season and the 2009-10 campaign, one where Liverpool struggled to seventh place and ultimately saw Benitez sacked.
However, that similarity comes with at least one caveat. This season's match at Tottenham was an aberration in extremis. In the past three seasons, Liverpool took fewer than eight shots in just one other match: the 1-2 loss at United in '09-10. After Adam's early red card, Liverpool were lucky to get those three shots. That Liverpool have incurred first-half red cards before and still managed more than three shots suggests it truly was an exceptional aberration, one which substantially affects the above totals.
Also, as results under Hodgson proved, more shots isn't always better. Not that we needed to live through the Era of Roy to learn that. Of course, sometimes more is better; Liverpool averaged 19.4 shots per game in 2008-09 (approximately four more per game than '10-11 and '11-12 so far and 2.5 more than '09-10), which led to an average of 2.05 goals per game. But that season, Liverpool averaged 9.46 shots per goal – almost exactly the rate from the seven games analyzed in '09-10. The season-long shots per goal averages for '09-10 and '10-11 were 10.56 and 9.86 respectively. Unsurprisingly, the '10-11 average was heavily impacted by the managerial change; Liverpool averaged 12.92 shots per goal during Hodgson's 20 games and 7.77 shots per goal in Dalglish's 18.
What's changed – besides the line-up, obviously – between Dalglish's side last season and the seven games so far in this? Liverpool averaged 15.1 shots per game under Dalglish last season, and 15.3 so far in this. Which makes the increase in shots off target significant. 46% of shots have been off target this season, compared to 37% in '10-11 and 36% in '09-10 in the same seven fixtures. Liverpool had more shots off target than on in five of the seven matches, with the totals equal in the other two. In Dalglish's 18 games last season, Liverpool had more shots on target than off (one more, actually: 105 to 104). This season, the team was particularly wasteful against Sunderland and Stoke, and the results clearly suffered.
Long story short: score more goals please. However, that's not necessarily dependent on firing more shots in the general vicinity of the opposition's net.
3 comments :
Just thought I'd add a comment to this post, as the previous post's numbers humble this one a little too much.
Sure, one comment won't come close to making up the difference, but a litte consolation never hurt anyone.
Guess I could congratulate you on another excellent post, if you insist.
Excellent post and picture. Did you draw the table on your own, I mean the Shots chart!
Really interesting, what do you think about the next game Liverpool V Manchester United.
Check out my views of the game at http://englishpremierleaguepreview.blogspot.com
Such a huge game coming up Bo... Wish we have a top 10 list from Nate on most important results against Utd in recent memory.
I believe we will win. The break will hopefully have stopped Utd's momentum and given Suarez a little bit of a break which I believe he needs. Once again, hoping everyone comes back safe from break... *crosses fingers*
Post a Comment