The idea for this style of comprehensive infographic is from the incredible On Goals Scored, who did similar for the Euro 2012 final. All statistics sourced from StatsZone and Squawka.
My goal is to do this type of graphic for all the "big matches" this season – although I'm not yet willing to define "big matches" yet, as these take a fair amount of time to put together.
7 comments
:
drew
said...
Shooting accuracy still a concern. Think that at least is one area Dempsey, Sturridge, or whoever would help immediately.
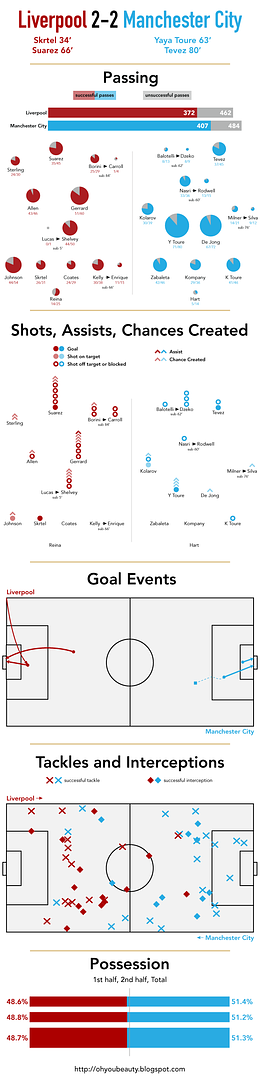
I'm assuming the stats don't lie but I'm stunned that Citeh had more possession and more successfully completed passes than Liverpool. I'd never have called that while watching the game, rose-tinted specs I suppose...
Possession ebbed and flowed. As said in yesterday's match review, it was 37-63% midway through the first half, but 49-51% at halftime. Which means that from 23'-45', Liverpool had around 61% possession. Similarly, but not as noticeably and I don't have the numbers, the second half went back and forth; Liverpool with more of the ball for the first 10-15 minutes of the half, then City with more of the ball after substitutions, then Liverpool settling into more possession after retaking the lead with a goal against the run of play, then frantic final 10-15 minutes which City edged.
As for number of passes, that City's surpassed Liverpool was almost totally because of Yaya Toure and De Jong's passes in the middle, which – for the most part – were mostly harmless (although Yaya + De Jong created four of City's six chances). What surprised me were how few passes Balotell+Dzeko and Milner+Silva made. Nasri was also quieter than usual; 33/36 over 60 minutes would average out to 50/54 over 90 minutes. Comparatively, he was 73/77 passing last week against Southampton. No created chances on Sunday compared to 5 created a week ago.
StatsZone's pass combinations helps clarify this point. Liverpool's three top pass combinations were Johnson to Sterling (14), Gerrard to Suarez (13), Suarez to Gerrard (10) – all attacking combinations. City's were Yaya to De Jong (19), De Jong to Yaya (15) and Nasri to Yaya (14) – all passes which mostly went sideways or backwards.
City made more passes, but Liverpool made more threatening passes – for good and ill. Incidentally, both City and Liverpool attempted and completed more passes in this fixture last year. 407/502 for Liverpool, 416/489 for City.
Drew,
You can do better than Sturridge if your criteria is shooting accuracy. His was 44% last season, same as Suarez's. But, because Suarez took so many more shots, Suarez averaged a shot on target every 53.27 minutes. Sturridge averaged a shot on target every 70.88 minutes. Chance conversion? Sturridge 15%, Dempsey 16%, Suarez 10%. Clear-cut chance conversion? Suarez 25%, Sturridge 38%, Dempsey 45%. Suarez averaged 232 minutes per goal, Sturridge 206.2, Dempsey 195.5.
I expect Suarez's stats will improve this season – they have to! – while Dempsey's will probably drop, given age and past performance. Don't know enough of Sturridge to know whether last season was par for the course, he is still young after all.
Great graphic, looks so good on the eye and so easy to see quickly which player did well or didn't. Suárez really needs to improve his shooting accuracy, although that FK was out of this world. My jaw dropped and stayed on the ground for 2 minutes when that curled in..
Who would you like to see Liverpool sign as goalscoring player instead of Sturridge? I find Sturridge too greedy and frustrating at times but is there a better player on the market right now who is available?

7 comments :
Shooting accuracy still a concern. Think that at least is one area Dempsey, Sturridge, or whoever would help immediately.
I'm assuming the stats don't lie but I'm stunned that Citeh had more possession and more successfully completed passes than Liverpool. I'd never have called that while watching the game, rose-tinted specs I suppose...
Rob,
Possession ebbed and flowed. As said in yesterday's match review, it was 37-63% midway through the first half, but 49-51% at halftime. Which means that from 23'-45', Liverpool had around 61% possession. Similarly, but not as noticeably and I don't have the numbers, the second half went back and forth; Liverpool with more of the ball for the first 10-15 minutes of the half, then City with more of the ball after substitutions, then Liverpool settling into more possession after retaking the lead with a goal against the run of play, then frantic final 10-15 minutes which City edged.
As for number of passes, that City's surpassed Liverpool was almost totally because of Yaya Toure and De Jong's passes in the middle, which – for the most part – were mostly harmless (although Yaya + De Jong created four of City's six chances). What surprised me were how few passes Balotell+Dzeko and Milner+Silva made. Nasri was also quieter than usual; 33/36 over 60 minutes would average out to 50/54 over 90 minutes. Comparatively, he was 73/77 passing last week against Southampton. No created chances on Sunday compared to 5 created a week ago.
StatsZone's pass combinations helps clarify this point. Liverpool's three top pass combinations were Johnson to Sterling (14), Gerrard to Suarez (13), Suarez to Gerrard (10) – all attacking combinations. City's were Yaya to De Jong (19), De Jong to Yaya (15) and Nasri to Yaya (14) – all passes which mostly went sideways or backwards.
City made more passes, but Liverpool made more threatening passes – for good and ill. Incidentally, both City and Liverpool attempted and completed more passes in this fixture last year. 407/502 for Liverpool, 416/489 for City.
Drew,
You can do better than Sturridge if your criteria is shooting accuracy. His was 44% last season, same as Suarez's. But, because Suarez took so many more shots, Suarez averaged a shot on target every 53.27 minutes. Sturridge averaged a shot on target every 70.88 minutes. Chance conversion? Sturridge 15%, Dempsey 16%, Suarez 10%. Clear-cut chance conversion? Suarez 25%, Sturridge 38%, Dempsey 45%. Suarez averaged 232 minutes per goal, Sturridge 206.2, Dempsey 195.5.
I expect Suarez's stats will improve this season – they have to! – while Dempsey's will probably drop, given age and past performance. Don't know enough of Sturridge to know whether last season was par for the course, he is still young after all.
Also, I really don't like Sturridge.
Great graphic, looks so good on the eye and so easy to see quickly which player did well or didn't. Suárez really needs to improve his shooting accuracy, although that FK was out of this world. My jaw dropped and stayed on the ground for 2 minutes when that curled in..
Who would you like to see Liverpool sign as goalscoring player instead of Sturridge? I find Sturridge too greedy and frustrating at times but is there a better player on the market right now who is available?
Excellent infographics!
Very nice way to show the stats, nate!
I liked the part with shots and chances created. Shows the importance of players like Jonjo.
Post a Comment